USAID Intelligent Forecasting
Introduction
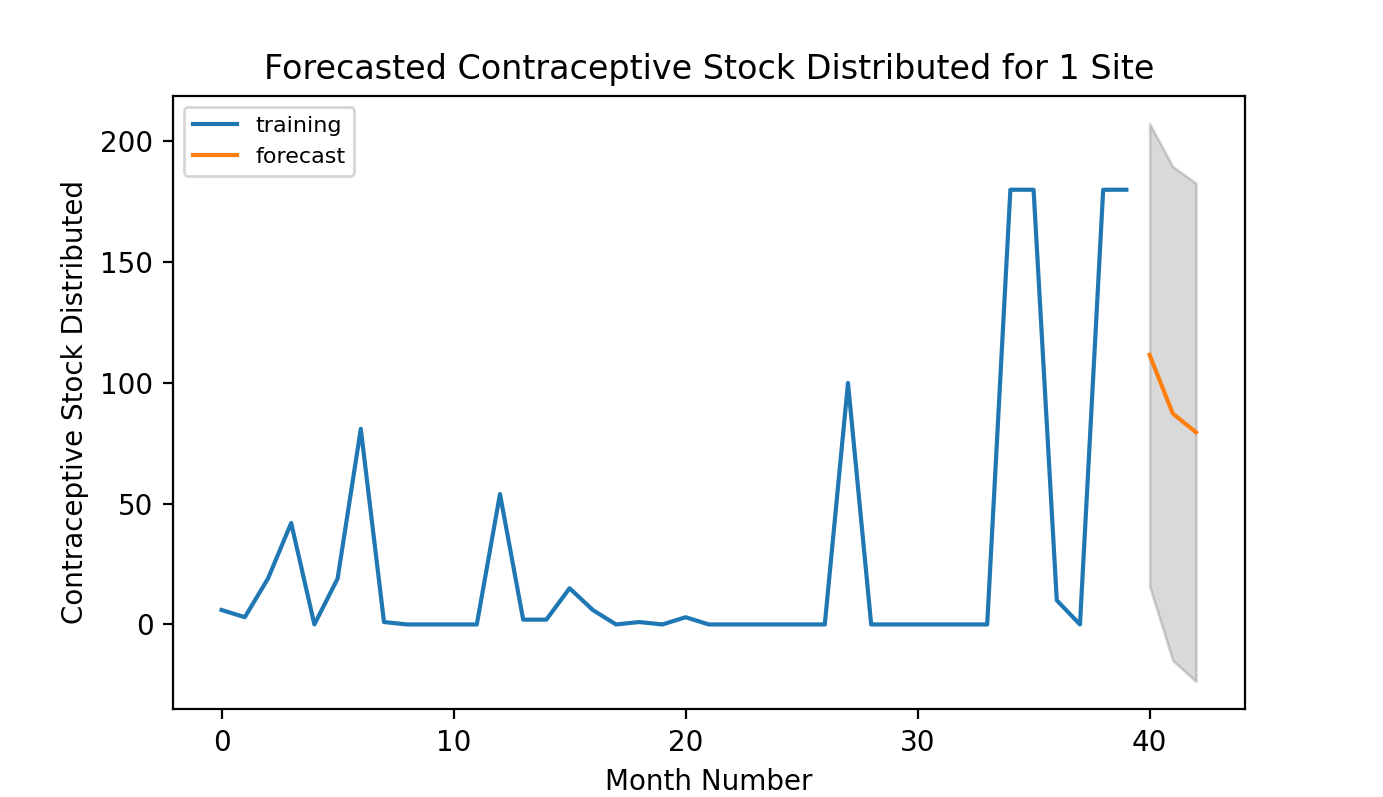
USAID recently offered a challenge. The agency wanted to identify more accurate methods of predicting future contraceptive use at health delivery sites using artificial intelligence (AI) and machine learning (ML) in order to ensure the right quantity of contraceptives could be delivered to each site at the right time. It was a perfect opportunity for our Excella team to combine our commitment to public health with our knowledge of data science to come up with creative solutions.
Although USAID’s goal was to improve delivery of contraceptives in over 40 countries across the globe, the sample data they offered was for Côte d’Ivoire (Ivory Coast). Using approximately 38,000 rows of historical data, they asked challenge participants to predict contraceptive use at over 150 sites during the last three months of 2019. USAID would compare those predictions with actual use during those months and award a winner based on the accuracy of the model.
A Time Series Problem
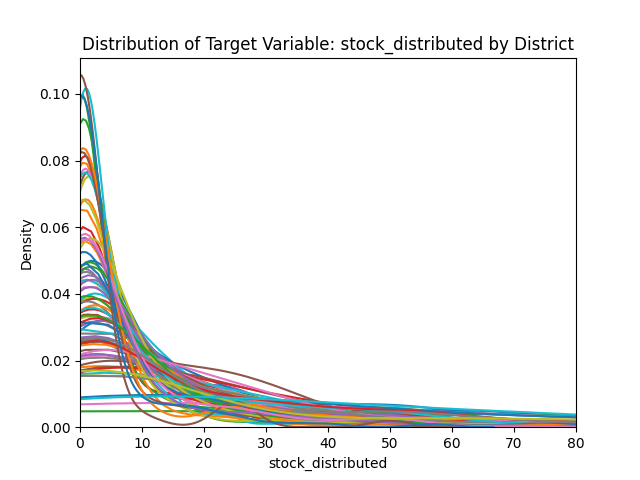
Forecasting contraceptive use is a time series modeling problem. Future contraceptive use can be expressed as a function of past contraceptive use combined with other relevant variables. We explored a variety of approaches to determine the best. Time was a crucial factor. We learned about the challenge late, so our five-person team worked a compressed four-week schedule.
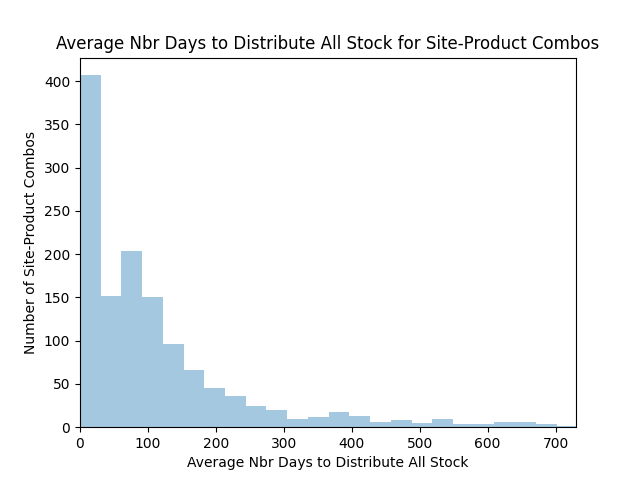
We needed to be able to quickly validate and assess our work, so we spent the first week getting familiar with the data, cleaning it, and setting up an evaluation framework. This is an approach we typically take in data science work. If we have a baseline to evaluate against, we can quickly know whether changes we’re making are improving our model. In this case, we started with a baseline model that just used historical averages to predict future contraceptive use.
Exploring the Possibilities
Over the next two weeks, we iteratively developed a series of different models to create the best forecast. We moved through them quickly using our familiarity with a variety of different technologies, including Keras/TensorFlow, Pandas, scikit-learn, and Facebook Prophet.
We created and evaluated four different models.
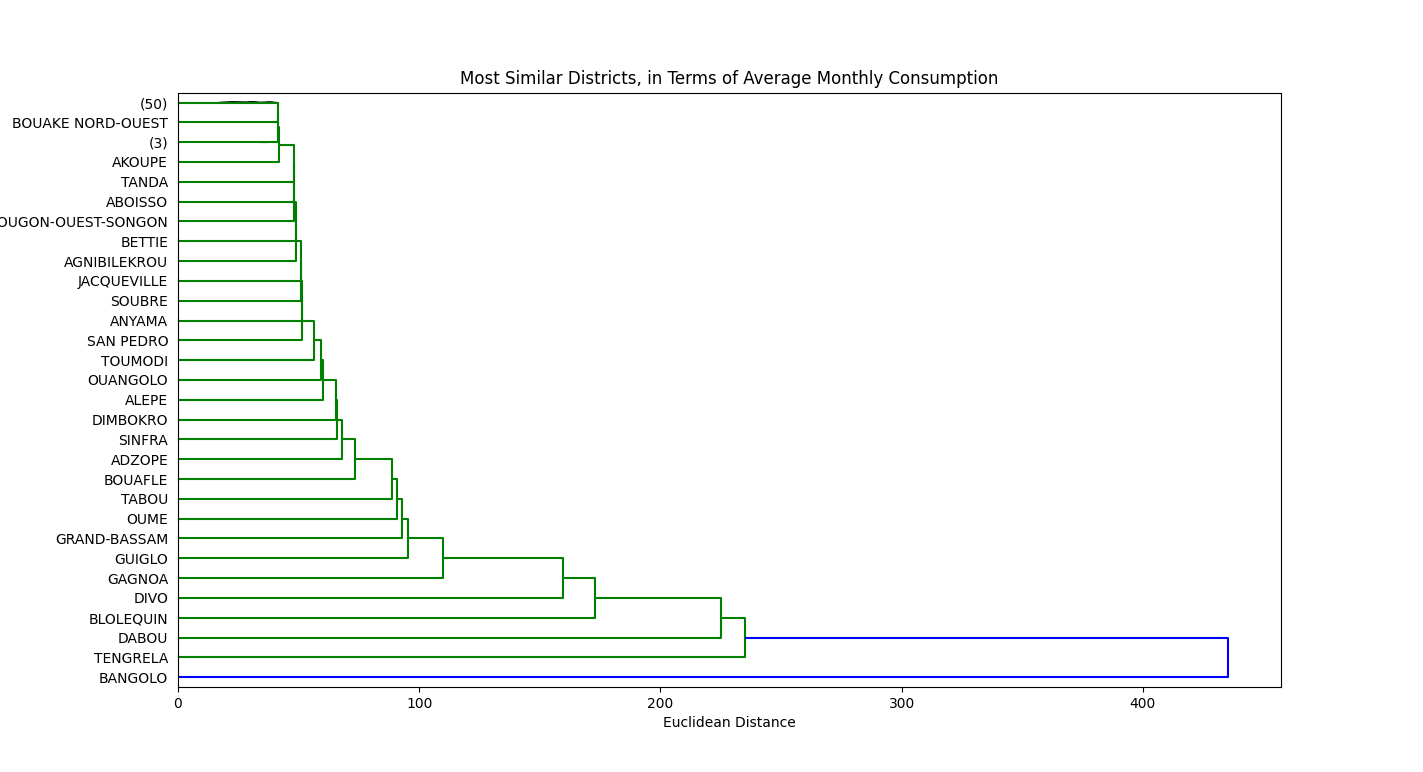
We also brought in a variety of other data sources that we felt would improve our models’ predictions. These data sources included historical climate information, poverty and income inequality, consumer spending, and distance (from the distribution clinic to major urban centers). We found that many of these publicly available data sources enhanced the performance of the model.
Evaluating our Options
Our random forest models gave the best results. Random forest models are supervised ML algorithms that build multiple decision trees and ensemble them to get more accurate and stable predictions. They can indicate the importance of different variables, which helped us determine which data sources were most important and improved our ability to explain how our model arrived at predictions. At Excella, we’re committed to explainable AI.
We were disappointed with Facebook Prophet, but were grateful for the opportunity to evaluate it. It was originally developed to predict the growth of Facebook’s user base, so it has less flexibility in terms of input variables and doesn’t account for stochastic volatility the way other approaches, like random forests, do.
Conclusion
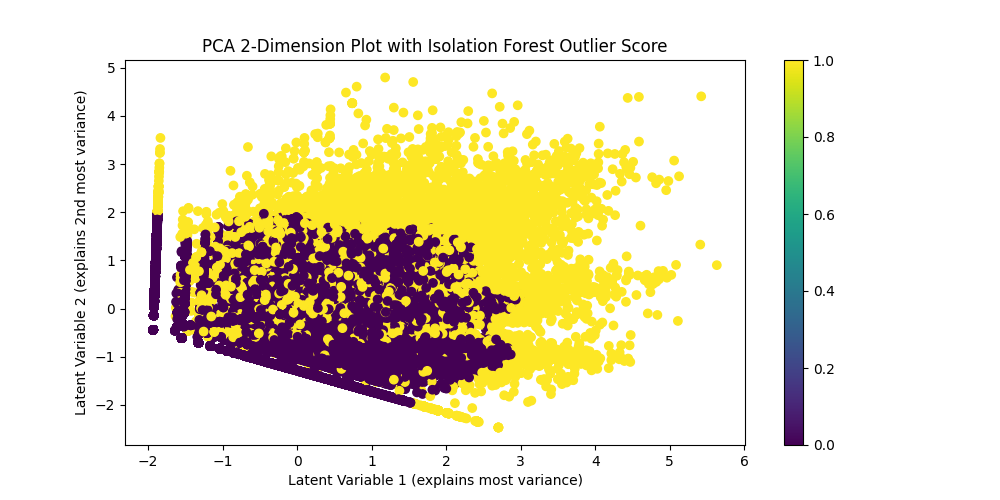
Since we were allowed up to three submissions, we submitted our three best random forest models to USAID. If we had more time, we would have enhanced them by adding outlier detection, since our models were sensitive to them, and applying some logic to filter them or reduce their impact would have enhanced the accuracy of the model even further.
We valued the opportunity to work on this challenge, showcase our capabilities in this area, and help USAID with an important public health challenge. The approaches we took are applicable in many other areas, including:
- Logistics (essentially, predicting contraceptive consumption is a logistical problem).
- Anomaly detection (since we can use time series models to predict future values, we could detect values outside of the predicted range).
- Signal processing (predicted ranges can also help separate signal from noise and enhance processing).
- Classification (different time series data points can be grouped by type using different criteria).
We’re looking forward to the next opportunity to take on a ML challenge and work on it in Excella Labs.