Over the last four+ months, the world has logged on daily to track case counts of COVID-19. As a public health professional and data visualization designer, I’ve watched as charts and maps shaped the public’s understanding of COVID-19, but also watched as armchair epidemiologists published charts of miscalculated case fatality ratios and drew conclusions from messy, incomplete data.
During this time, I’ve written articles, chatted on podcasts, and conducted interviews about the complexity of visualizing COVID-19 data, starting with Ten Considerations Before You Make Another Chart of COVID-19. The article was a call to the data viz community to viz responsibly: collaborate with public health experts to understand the nuances of the data, and perhaps pause before publishing a visualization in the public domain if the designer lacked an understanding of the complexity of the data.
But readers of charts and graphs far outnumber the designers of data visualizations. The principles of Alberto Cairo’s How Charts Lie are more relevant today than ever before, with added nuance and complexity as how data is collected, analyzed, and reported about an emerging pandemic evolves and changes over time.
Three Questions to Ask when Reading COVID-19 Visualizations
Charts and graphs imply a certain truthfulness and certainty in the data presented, which is why they can be so powerful in shaping our perceptions and understanding. When the line measuring case counts goes up, we likely interpret that cases are increasing.
But what if other factors in how the data is collected and used shapes those numbers? As a few examples, consider:
- Increases or declines may simple be a function of the volume of tests being done
- Reporting delays can cause noise in the data, declines on Sundays and Mondays, and then a rebound with a jump up on Mondays and Tuesdays purely because of when numbers are logged into a reporting system
- Case counts are recorded based on the date they’re reported, not the date a swab was taken or someone fell ill. As a result, today’s new case represent people who were sick days or even a week prior – which is an even greater challenge
- The definition of what qualifies as a case has change over time, evolving to include probable cases rather than only those that were laboratory confirmed. We’ve even expanded what labs are qualified to run tests; early on, tests done at private labs in the US had to be confirmed at a CDC laboratory.
While the more detailed recommendations I shared back in March in Fast Company on how to read COVID-19 charts and be informed but not terrified still hold true, it’s a long read. Here are three questions you can keep in mind as you read charts of COVID-19 data.
1. What other indicators do I need in order to understand the changes in the case numbers?
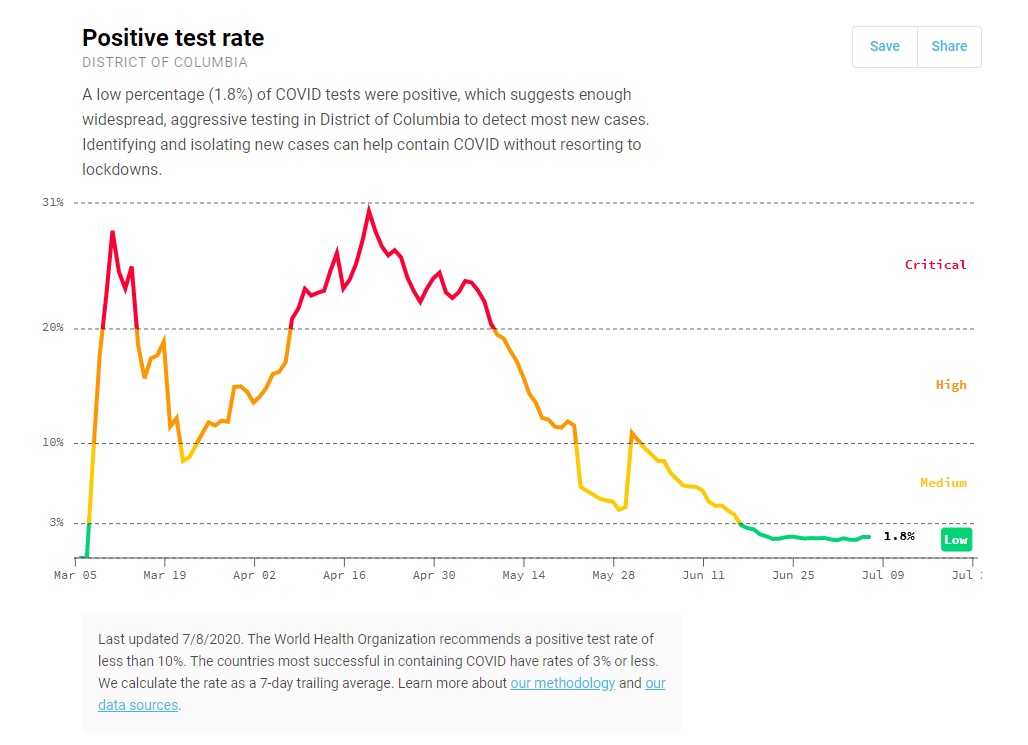
To make sense of case counts, we need to look at the volume of tests being done and the share of tests with a positive result (test positivity). We should look for a relatively low test positivity, to indicate we are testing enough people to find cases, which enables us to support isolation and quarantine measures to prevent further community spread.
COVID Act Now includes a state level analysis of four key indicators, including test positivity, and provides clear benchmarks for when we should be concerned around each metric.
2. What lags exist in how the data is reported or between different indicators?
As case counts rise in US throughout June, journalists have noted that deaths attributed to COVID-19 have not increased yet.
There is a lag between increases in the different indicators used to monitor the pandemic: cases increase first, then hospitalizations, then deaths. Dr. Ellie Murray, Epidemiologist and Assistant Professor at the Boston University School of Public Health, unpacks this issue of lead time bias in one of her excellent “Think Like an Epidemiologist Tweetorials”.
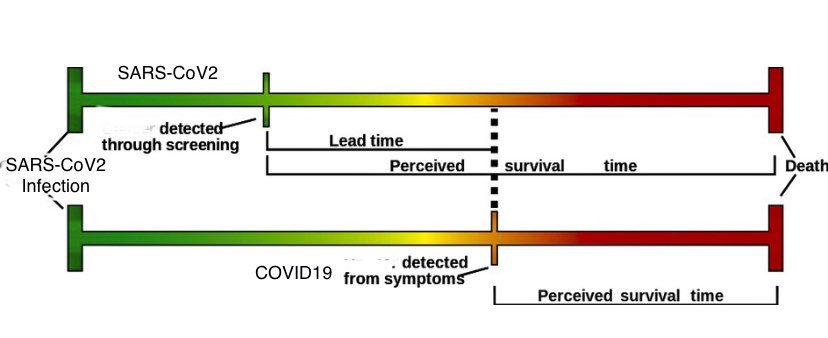
Image credit @epiellie
Similar considerations around lags need to be applied when looking for spikes in cases associated with mass gathering events, like Memorial Day festivities or large protests.
While there isn’t a consistent timeline, we can piece together a minimum window based on testing guidelines and response times. Recommendations to those who may have been exposed have been to wait five to seven days to get tested (even if asymptomatic). Then the patients wait for the laboratory to return test results (which, ideally, is within 3 days, but in many municipalities is currently taking longer; as of July 8, the DC government estimated a 3-5 day turnaround). Taking those numbers as a guide, the lag from event to case counts increasing would likely be close to two weeks or more.
3. How would this information need to be disaggregated to tell a more complete story?
Aggregations can hide information. Early in the spread of COVID-19 in the US, few states or municipalities were reporting case data disaggregated by race. In public health, there are sometimes practical, privacy related reasons not to disclose demographic information in an outbreak – namely when the case numbers are low and the count of cases for a given location/age/race combination is small, increasing the risk of identifying the patient.
As case counts climbed in the US, it became clear in cities and counties that were reporting data disaggregated by race that Black communities were being disproportionately impacted. In public health, we look at social determinants of health and systems issues that drive a disproportionate burden of disease in a community. The wider availability of race disaggregated data (with 49 of 50 states reporting – North Dakota is the only exception) enables further analysis and understanding that can inform additional research and understanding around this burden on our Black communities. See the COVID Tracking Project’s Racial Data Dashboard for more detailed information.
Even at a more individual level, national trends in the US mask the reality of different outbreaks across states and regions. Regions hit early, including the Northeast and West Coast, have different trends than Southern states with mounting case counts. In DC, data about the spread of COVID in the District helps me understand the current risk, but I also want to know about the trends in adjacent counties in Virginia and Maryland. In an outbreak, drilling down to local data (rather than aggregate national figures) can better inform my individual decision making. (Though no matter what the numbers, I’ll still be wearing my mask anytime I leave the house and keeping my physical distance at 6 feet or more.)
Learning to Read More Complex Charts
There’s no doubt that data visualization has been in the spotlight as a means of communicating public health information to a broad audience. Never did I expect that interpreting information on logarithmic scaled axes would be common place, but John Burn-Murdoch of the Financial Times brought his audience along when publishing early daily updates of his COVID-19 case report.
Whether reviewing a simple trend chart or more complex visual, be mindful of the complexities and nuances in COVID-19 data. As a field, data visualization is still exploring the best ways to visualize uncertainty in data – so for now, those epidemic curves will look more finite than the underlying data really is.
For an excellent long read on the key metrics used to track COVID-19, including cases, testing, test positivity, and hospitalizations, check out this excellent long read from Propublica.
If you’re a data consumer, looking for more information on the presentation of charts and graphs for the broad public, I’d recommend the following reading/listening:
- Coronavirus Charts: How to Be Informed by Not Terrified (Fast Company)
- Move Over Data Visualization: the Era of Data Simulation is Here (Fast Company)
- How Data Visualizations Drive Decisions (Government Computer News)
- If Data Could Talk: Color legends, data uncertainty and forecasting pitfalls (Tableau YouTube)
If you’re a data visualization designer or data journalist, seeking more insights on how to responsibly visualize COVID-19 data, I’d recommend the following:
- A Data Designer’s Responsibility in a Global Crisis (Van Schneider)
- Ten Considerations Before You Create Another Chart About COVID-19 (DVS Nightingale)
- A conversation with an Epidemiologist: 5 things to keep in mind when you look at the numbers on COVID-19 (Tableau Blog)
- Visualizing coronavirus data? Consider adding a disclaimer (Tableau Blog)
- Ethical Design Recommendations for COVID-19 Visualizations (DVS Nightingale)
You Might Also Like
WIP Limit Zero: How Slack Makes Us More Creative
Doing nothing gives us the space to develop focus, process our experiences and find the...
Enabling Data-Led Communications about Preventing the Spread of COVID-19
Counting coronavirus cases and related statistics can tell us where infections are rising. But what...
Pandemic Response: Succeeding with Agility
McKinsey recently published an article that differentiated between ‘agile’ organizations and less agile ones. They...